时间:2023-08-07 10:03
人气:
作者:admin
不知道大家有没有遇到这种情况,接口业务逻辑写完后,用 postman 一调,发现接口响应时间好长,不得不对接口进行优化。
但是此时接口的代码往往逻辑比较复杂,调用层次也比较多,很难定位到耗时较长的代码块
遇到这种情况大家都是如何定位耗时代码块的呢?
我看到很多人都是直接用System.currentTimeMillis()对代码进行埋点
publicstaticvoidmain(String[]args){
LongstartTime=System.currentTimeMillis();
exec();
LongendTime=System.currentTimeMillis();
log.info("exec方法执行耗时:{}ms",endTime-startTime);
}
或者用StopWatch打印方法耗时
publicstaticvoidmain(String[]args)throwsInterruptedException{
StopWatchstopWatch=newStopWatch();
stopWatch.start("exec");
exec();
stopWatch.stop();
System.out.println(stopWatch.prettyPrint());
}
这两种方法本质上是一样的,都是通过手动在代码块上进行埋点,打印出方法的耗时,该方法不仅费时费力,而且对代码有侵入,修复问题后删掉代码还是一个麻烦事
下面介绍如果通过Arthas定位耗时代码块
Arthas 简介
Arthas是阿里开源的一款 Java 诊断工具,可以在无需重启 JVM 的情况下,实时查看应用 load、内存、gc、线程等状态信息,还能实时查看方法调用入参、出参、方法调用耗时等
Arthas 快速开始
直接下载Arthasjar 包,然后用java -jar命令启动即可
$curl-Ohttps://arthas.aliyun.com/arthas-boot.jar
$java-jararthas-boot.jar
Arthas启动的时候,会打印出当前运行的 java 进程
$java-jararthas-boot.jar
[INFO]JAVA_HOME:/Library/Java/JavaVirtualMachines/jdk1.8.0_351.jdk/Contents/Home/jre
[INFO]arthas-bootversion:3.6.9
[INFO]Foundexistingjavaprocess,pleasechooseoneandinputtheserialnumberoftheprocess,eg:1.ThenhitENTER.
*[1]:12512com.huangxy.springstudy.SpringStudyApplication
[2]:12511org.jetbrains.jps.cmdline.Launcher
然后可以选择我们需要 attach 的 java 进程,这里我们选择 1,然后按回车。Arthas 会 attach 到目标进程上,并输出日志:
[INFO]arthashome:/Users/huangxiaoyu/.arthas/lib/3.6.9/arthas
[INFO]Trytoattachprocess12512
[INFO]Attachprocess12512success.
[INFO]arthas-clientconnect127.0.0.13658
,---.,------.,--------.,--.,--.,---.,---.
/O|.--.''--..--'|'--'|/O'.-'
|.-.||'--'.'|||.--.||.-.|`.`-.
||||||||||||||||.-'|
`--'`--'`--''--'`--'`--'`--'`--'`--'`-----'

wikihttps://arthas.aliyun.com/doc
tutorialshttps://arthas.aliyun.com/doc/arthas-tutorials.html
version3.6.9
main_classcom.huangxy.springstudy.SpringStudyApplication
pid12512
time2023-07-2509:14:22
到这里,Arthas 已经 attach 到我们的目标进程上了,我们尝试使用dashboad命令,查看进程的信息
$dashboard
IDNAMEGROUPPRIORITYSTATE%CPUDELTA_TIMETIMEINTERRUPTDAEMON
36DestroyJavaVMmain5RUNNABLE0.00.0000:1.748falsefalse
-1C1CompilerThread3--1-0.00.0000:0.761falsetrue
-1VMPeriodicTaskThread--1-0.00.0000:0.237falsetrue
24http-nio-8081-exec-1main5WAITING0.00.0000:0.098falsetrue
-1VMThread--1-0.00.0000:0.071falsetrue
25http-nio-8081-exec-2main5WAITING0.00.0000:0.055falsetrue
54arthas-NettyHttpTelnetBootstrasystem5RUNNABLE0.00.0000:0.054falsetrue
-1GCtaskthread#8(ParallelGC)--1-0.00.0000:0.043falsetrue
-1GCtaskthread#1(ParallelGC)--1-0.00.0000:0.043falsetrue
-1GCtaskthread#7(ParallelGC)--1-0.00.0000:0.042falsetrue
-1GCtaskthread#6(ParallelGC)--1-0.00.0000:0.042falsetrue
-1GCtaskthread#0(ParallelGC)--1-0.00.0000:0.042falsetrue
-1GCtaskthread#9(ParallelGC)--1-0.00.0000:0.042falsetrue
-1GCtaskthread#2(ParallelGC)--1-0.00.0000:0.042falsetrue
-1GCtaskthread#3(ParallelGC)--1-0.00.0000:0.042falsetrue
-1GCtaskthread#5(ParallelGC)--1-0.00.0000:0.042falsetrue
-1GCtaskthread#4(ParallelGC)--1-0.00.0000:0.042falsetrue
MemoryusedtotalmaxusageGC
heap83M432M7282M1.14%gc.ps_scavenge.count4
ps_eden_space72M212M2688M2.69%gc.ps_scavenge.time(ms)24
ps_survivor_space0K21504K21504K0.00%gc.ps_marksweep.count2
ps_old_gen10M199M5461M0.20%gc.ps_marksweep.time(ms)61
nonheap53M56M-194.71%
code_cache6M7M240M2.87%
metaspace40M43M-194.45%
compressed_class_space5M5M1024M0.53%
direct16K16K-100.01%
mapped0K0K-0.00%
Runtime
os.nameMacOSX
os.version13.0.1
java.version1.8.0_351
java.home/Library/Java/JavaVirtualMachines/jdk1.8.0_351.jdk/Contents/
Home/jre
systemload.average3.80
processors12
可以看到dashboad命令会展示一个实时的数据面板,列出了我们平时比较关心的数据指标,如内存使用量,gc 状态等
更多命令的使用,可以参考官网的命令列表
使用 Trace 命令统计方法耗时
trace命令能主动搜索class-pattern/method-pattern对应的方法调用路径,渲染和统计整个调用链路上的所有性能开销和追踪调用链路
比如下面接口
@RestController
publicclassHelloController{

@GetMapping("/test")
publicStringtest()throwsInterruptedException{
one();
two();
return"hello";
}

privatevoidtwo()throwsInterruptedException{
Thread.sleep(20);
three();
}

privatevoidthree()throwsInterruptedException{
Thread.sleep(1000);
}

privatevoidone()throwsInterruptedException{
Thread.sleep(100);
}

}
启动Arthas进程,并 attach 到我们的 springboot 项目上,接着使用trace命令跟踪方法的调用情况
$tracecom.huangxy.springstudy.controller.HelloControllertest
trace方法第一个参数是要 attach 的类的路径,第二个参数是方法名称,接着我们调用一遍接口,就能看到 hello 方法的调用堆栈及其耗时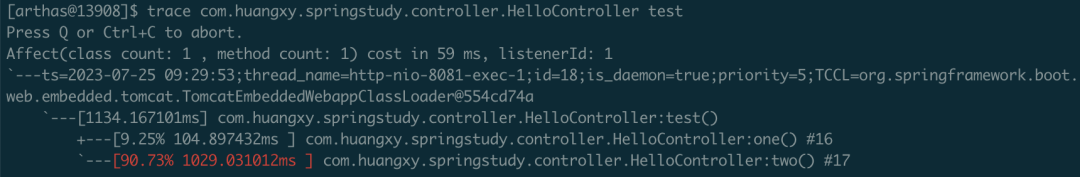
可以看到,这里耗时比较严重的是tow()方法,花了 1029ms,占了 90.73% 的比重
不过需要注意的是,trace 命令只会 trace 匹配到的函数里的子调用,并不会向下 trace 多层,如果需要 trace 多层,可以用正则匹配多个函数,如
$trace-E com.huangxy.springstudy.controller.HelloControllertest|two
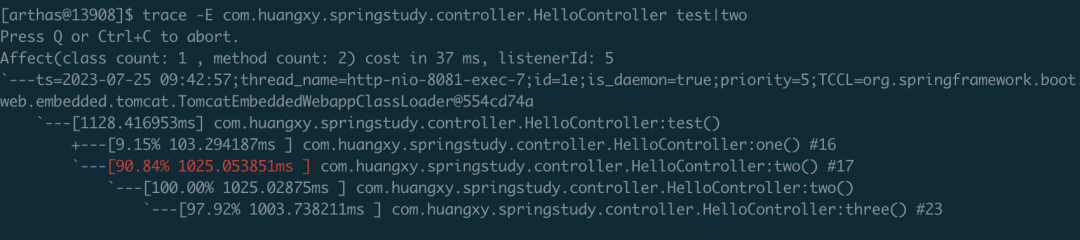 image.png
这下更清晰的定位到,导致耗时过长的方法是three()方法,定位到方法后,针对性的优化耗时代码块即可
审核编辑:刘清


 关注微信
关注微信