时间:2023-09-26 09:32
人气:
作者:admin
前几期,有朋友让我用python将cp的测试数据转化为map
但是,他又想把特定的测量数据转化为map图后,进行上色,即不同的测试数据能够呈现不同的颜色,以便于直观的观察其趋势。
数据样式:
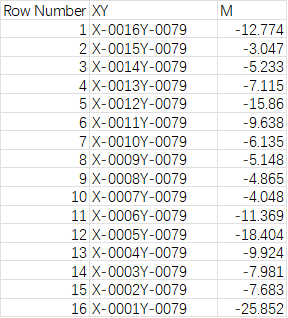
左边列是序号,中间列是XY,X-0016Y0079表示的是(X,Y)坐标为(16,79),最右行是测试数据。序号最大值为13278,即这个wafer有13278粒完成测试,得到了cp的测试数据。
我的思路:
1,将现有数据按照坐标,转化为map图,并将测试数值一一对应填入map图中。
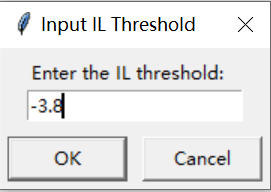
2,有时测试标准是不一样的,所以可以手动设置标准值,这个在运行程序时能够弹出对话框,让使用者能够随意更改标准。低于标准值的测量值单元格呈现浅红色到红色的渐变,高于标准值的测量值呈现浅绿到紫色的渐变。
做出的效果:
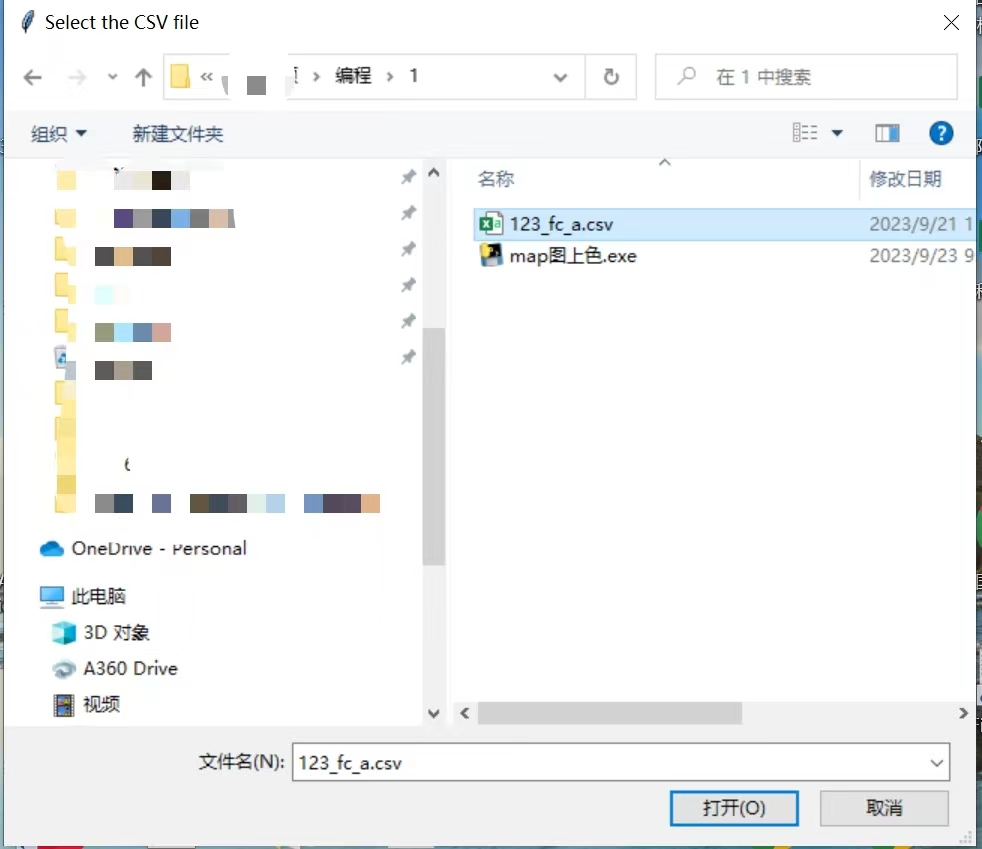
1,双击“map上色.exe”运行程序
2,选择要上色的测试数据文件
3,手动设置标准值
4,设置文件名
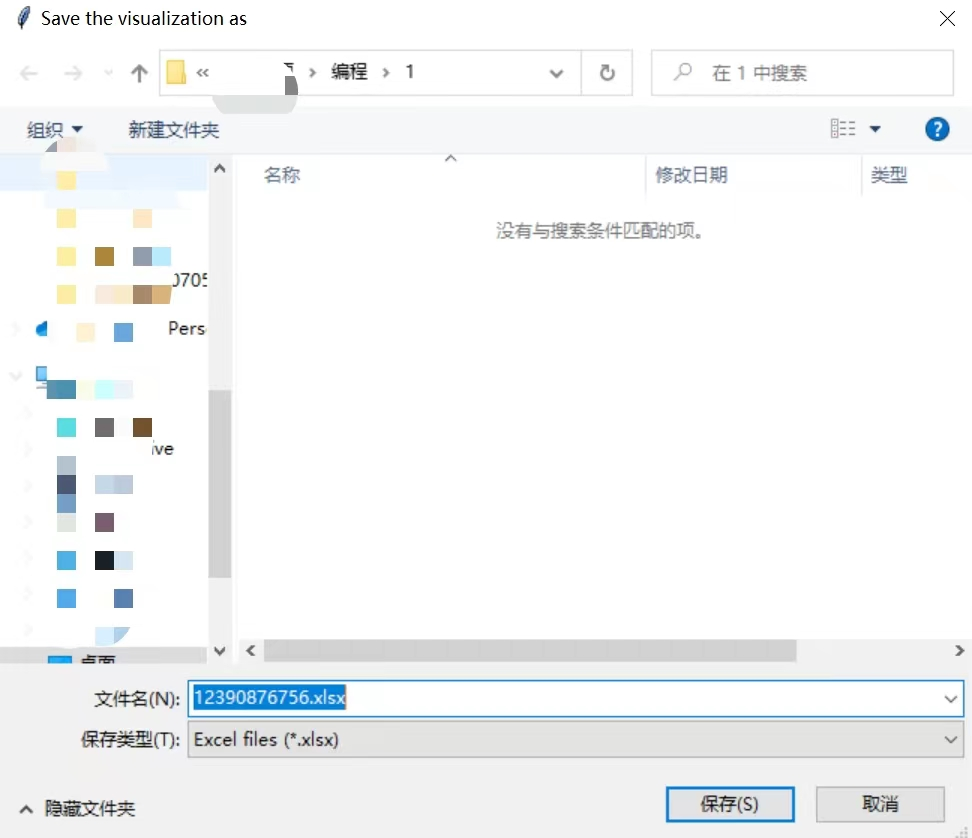
5,在原文件地址下输出包含map图的文件
6,打开文件

这样就很直观地看出测量值的分布图来了。
原代码如下,欢迎参考:
import pandas as pd
import numpy as np
import matplotlib.pyplot as plt
from openpyxl import Workbook
from openpyxl.utils.dataframe import dataframe_to_rows
from openpyxl.styles import PatternFill
from tkinter.simpledialog import askfloat
from tkinter import Tk
from tkinter import filedialog
import colorsys
from tkinter.simpledialog import askstring
def get_threshold(threshold_type):
    print(f"Getting threshold for {threshold_type}...")
    root = Tk()
    root.withdraw()

    if threshold_type == "IL":
        threshold = askfloat(f"Input {threshold_type} Threshold", f"Enter the {threshold_type} threshold:")
        return threshold
    elif threshold_type == "FC":
        threshold_range_str = askstring(f"Input {threshold_type} Threshold Range",
                                        f"Enter the {threshold_type} threshold range (e.g., 'min,max'):")
        print(f"User input for FC threshold: {threshold_range_str}")
        try:
            min_threshold, max_threshold = map(float, threshold_range_str.split(','))
            return min_threshold, max_threshold
        except ValueError:
            print("Invalid input. Please enter two numbers separated by a comma.")
            return None
    root.destroy()
def color_map(value, threshold, data_min, data_max):
    # 正常化值到 [threshold, data_max] 区间,从极淡绿(144,238,144)到紫(128,0,128)
    if threshold <= value <= data_max:
        normed_value = (value - threshold) / (data_max - threshold)
        r = int(144 * (1 - normed_value) + 128 * normed_value)
        g = int(238 * (1 - normed_value) + 0 * normed_value)
        b = int(144 * (1 - normed_value) + 128 * normed_value)

    # 正常化值到 [data_min, threshold] 区间,从红(255,0,0)到黄(255,255,0)
    elif -10 <= value < threshold:
        normed_value = (value + 10) / (threshold + 10)  # 正则化到 [0, 1] 区间
        r = int(222 + (241 - 222) * normed_value)  # 从 222 渐变到 241
        g = int(28 + (147 - 28) * normed_value)  # 从 28 渐变到 147
        b = int(49 + (156 - 49) * normed_value)  # 从 49 渐变到 156

    elif data_min <= value < -10:
        r, g, b = 139, 0, 0

    else:
        r, g, b = 255, 255, 255  # 默认为白色

    hex_color = 'FF' + '{:02X}{:02X}{:02X}'.format(r, g, b)
    return hex_color


def fc_color_map(value, min_threshold, max_threshold, data_min, data_max):
    if min_threshold <= value <= max_threshold:

        normed_value = (value - min_threshold) / (max_threshold - min_threshold)

        hue = normed_value * 360

        r, g, b = colorsys.hsv_to_rgb(hue / 360.0, 1, 1)  # Here saturation and value are both set to 1
        r, g, b = int(r * 255), int(g * 255), int(b * 255)

        hex_color = 'FF' + '{:02X}{:02X}{:02X}'.format(r, g, b)

    # For values outside the specified range
    elif value > max_threshold or value < min_threshold:
        r, g, b = 139, 0, 0
        hex_color = 'FF' + '{:02X}{:02X}{:02X}'.format(r, g, b)
    else:
        r, g, b = 255, 255, 255  # default to white
        hex_color = 'FF' + '{:02X}{:02X}{:02X}'.format(r, g, b)
    return hex_color
def save_to_excel(df, threshold, output_path, color_function):
    wb = Workbook()
    ws = wb.active

    data_min = df.min().min()  # 获取整个 dataframe 中的最小值
    data_max = df.max().max()  # 获取整个 dataframe 中的最大值

    for i in range(df.shape[0]):
        for j in range(df.shape[1]):
            value = df.iloc[i, j]
            if not pd.isna(value):
                cell = ws.cell(row=i + 2, column=j + 2)
                cell.value = value
                # 选择正确的颜色映射函数和参数
                if color_function == color_map:
                    fill_color = color_function(value, threshold, data_min, data_max)
                elif color_function == fc_color_map:
                    min_threshold, max_threshold = threshold  # 从元组中解包
                    fill_color = color_function(value, min_threshold, max_threshold, data_min, data_max)

                cell.fill = PatternFill(start_color=fill_color,
                                        end_color=fill_color,
                                        fill_type="solid")
    wb.save(output_path)

def rgb_to_hex(rgb):
    return '{:02X}{:02X}{:02X}'.format(rgb[0], rgb[1], rgb[2])


def main():
    print("Starting main function...")
    input_file = filedialog.askopenfilename(title="Select the CSV file")
    print(f"Selected file: {input_file}")
    if "il" in input_file.lower():
        threshold_type = "IL"
        color_function = color_map
        threshold = get_threshold(threshold_type)
    else:
        threshold_type = "FC"
        color_function = fc_color_map
        threshold = get_threshold(threshold_type)
    if threshold is None:
        print("Invalid threshold. Exiting program.")
        return

    output_file = filedialog.asksaveasfilename(title="Save the visualization as", defaultextension=".xlsx",
                                               filetypes=[("Excel files", "*.xlsx")])
    print(f"Output file: {output_file}")

    df = pd.read_csv(input_file)
    save_to_excel(df, threshold, output_file, color_function)

if __name__ == "__main__":
main()
审核编辑:刘清
下一篇:AD数据转换-SAR ADC介绍


 关注微信
关注微信